Open-source website monitoring means the software is yours: no monitor caps and no vendor deciding which feature you deserve. The payment is operational. You host it and keep it alive, and its checks run from wherever you put it.
The 7 tools below range from an afternoon Docker install to a toolkit you assemble, with each project's own claims, checked at the source. If you would rather compare hosted free tiers, the free uptime monitoring and free website monitoring pages hold those lists.
What open source trades you
The trade has three parts. Money: all of these cost nothing to license. Time: somebody installs, upgrades, backs up and debugs the monitor, and when it breaks at night that somebody is on your team. Vantage: a self-hosted check runs from your network, so it shares fate with your infrastructure and sees the internet from one place.
The first part is why people come. The other two decide whether they stay.
7 open-source monitoring tools compared
Uptimia wrote this page. The other tools are not ranked: their order is not a verdict on which is better.
1. Uptime Kuma
github.com/louislam/uptime-kuma
- What it is
- Self-hosted open-source monitoring tool under the MIT license, run with Docker or Node.js, with status pages built in.
- Check types
- Website (HTTP), Keyword, Ping, Port, DNS, Cron jobs (heartbeat), Status pages
- Prices checked
- 4 Nov 2026
Uptime Kuma is this category's default answer, with 93.2k GitHub stars: one Docker command brings up a dashboard that checks HTTP(s), keyword and JSON query checks, raw TCP, ping, DNS records, WebSocket, push-based monitors, Steam game servers and Docker containers, with alerts through 90-plus notification services and multiple status pages, mappable to specific domains.
It is MIT licensed and runs on Docker or Node.js. The structural limit is that everything happens on the one machine you installed it on: the checks, the history and the alerting all share that box's fate. Our Uptime Kuma guide covers setup, the limits and the comparisons in depth.
Good fit: anyone with a Docker host who wants monitoring running before dinner.
2. Gatus
github.com/TwiN/gatus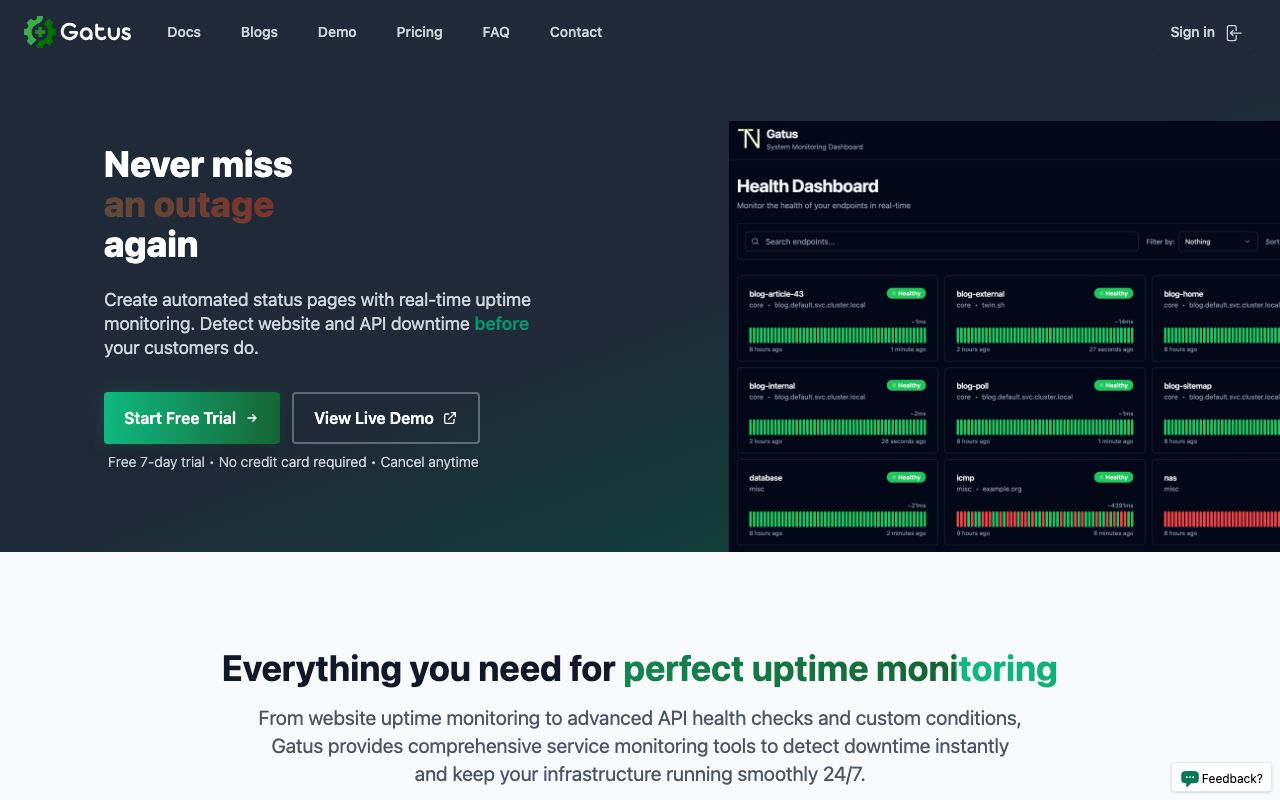
- What it is
- Open-source, self-hosted status page and monitoring service under the Apache 2 license, configured entirely from YAML files.
- Check types
- Website (HTTP), Ping, Port, DNS, SSL certificate, Domain expiry, Status pages
- Prices checked
- 4 Nov 2026
Gatus takes the opposite interface philosophy from Uptime Kuma: the whole setup lives in YAML files, so your monitoring is diffable and sits in git next to the services it watches. Checks are written as one-line conditions on the status code, the body and the response time, covering HTTP, ping, TCP, DNS, TLS and domain expiry.
It ships as a Docker image, Helm chart or single Go binary, under the Apache 2 license, with roughly 40 alerting providers.
Good fit: teams that keep infrastructure in code review and want monitoring held to the same standard.
3. Upptime
github.com/upptime/upptime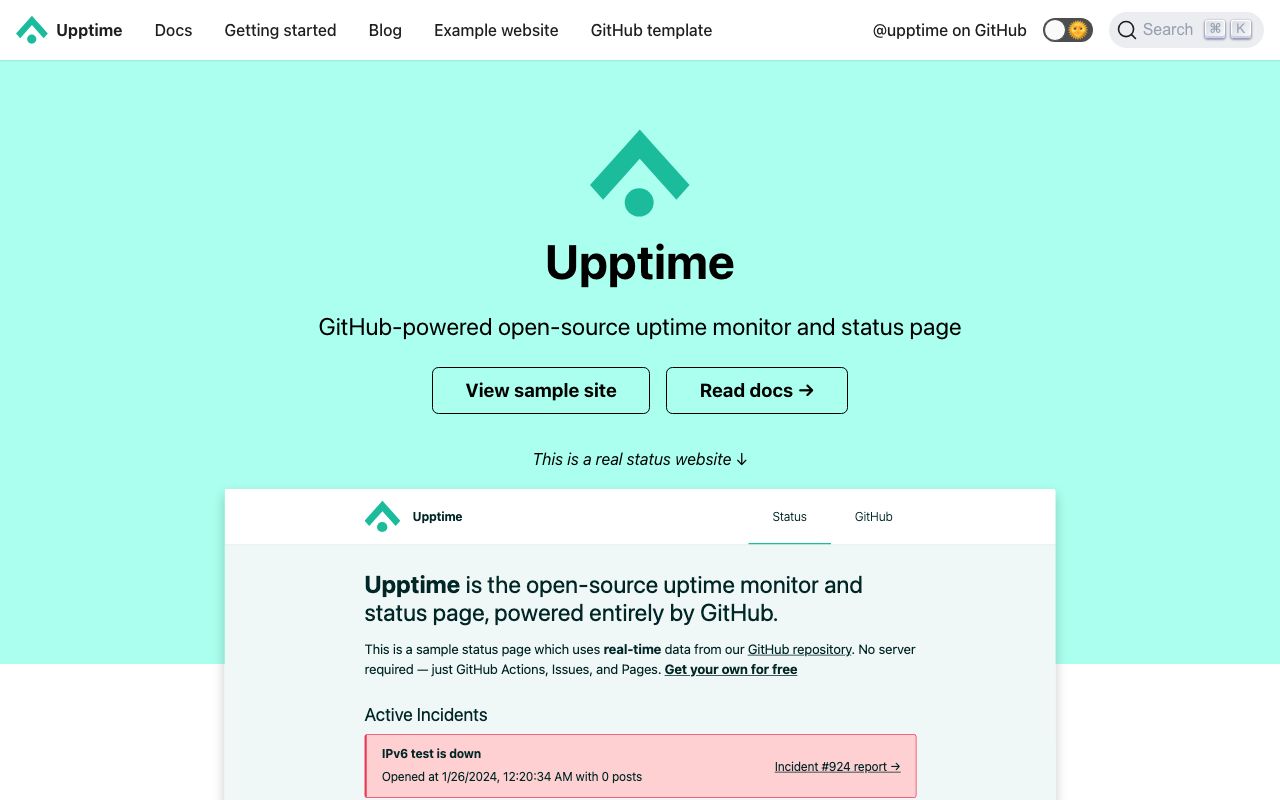
- What it is
- Open-source uptime monitor and status page powered entirely by GitHub Actions, Issues and Pages, with no server of its own.
- Check types
- Website (HTTP), Status pages
- Prices checked
- 4 Nov 2026
Upptime removes the server from self-hosting: checks run as GitHub Actions workflows every 5 minutes, an outage opens a GitHub issue that closes itself on recovery, and the status page is a static site on GitHub Pages. Response-time history lives in the repository itself.
The ceiling is built in. Checks come from GitHub's runners on a schedule you do not fully control, the interval floor is those 5 minutes, and alerting reaches Slack, Telegram, custom webhooks and more.
Good fit: open-source projects and portfolios that live on GitHub anyway and want a public status page for nothing.
4. Prometheus
prometheus.io
- What it is
- Open-source metrics and alerting system under the Apache 2 license, a CNCF graduated project; servers are monitored by scraping its node exporter.
- Check types
- Server agent, Website (HTTP), Ping, Port, DNS
- Prices checked
- 4 Nov 2026
Website checks in Prometheus go through the blackbox exporter, which probes endpoints from the outside over HTTP, HTTPS, DNS, TCP, ICMP and gRPC, exposing probe_success and timing metrics. One exporter probes many endpoints, and alerting rules fire on probe_success going to zero.
This is the heaviest option on the page for watching a website alone, and the strongest when the same stack already collects your application and server metrics. The monitoring arrives as parts, with Grafana and an alert router assembled around it.
Good fit: teams already running Prometheus who want uptime probes in the same query language as everything else.
5. Zabbix
zabbix.com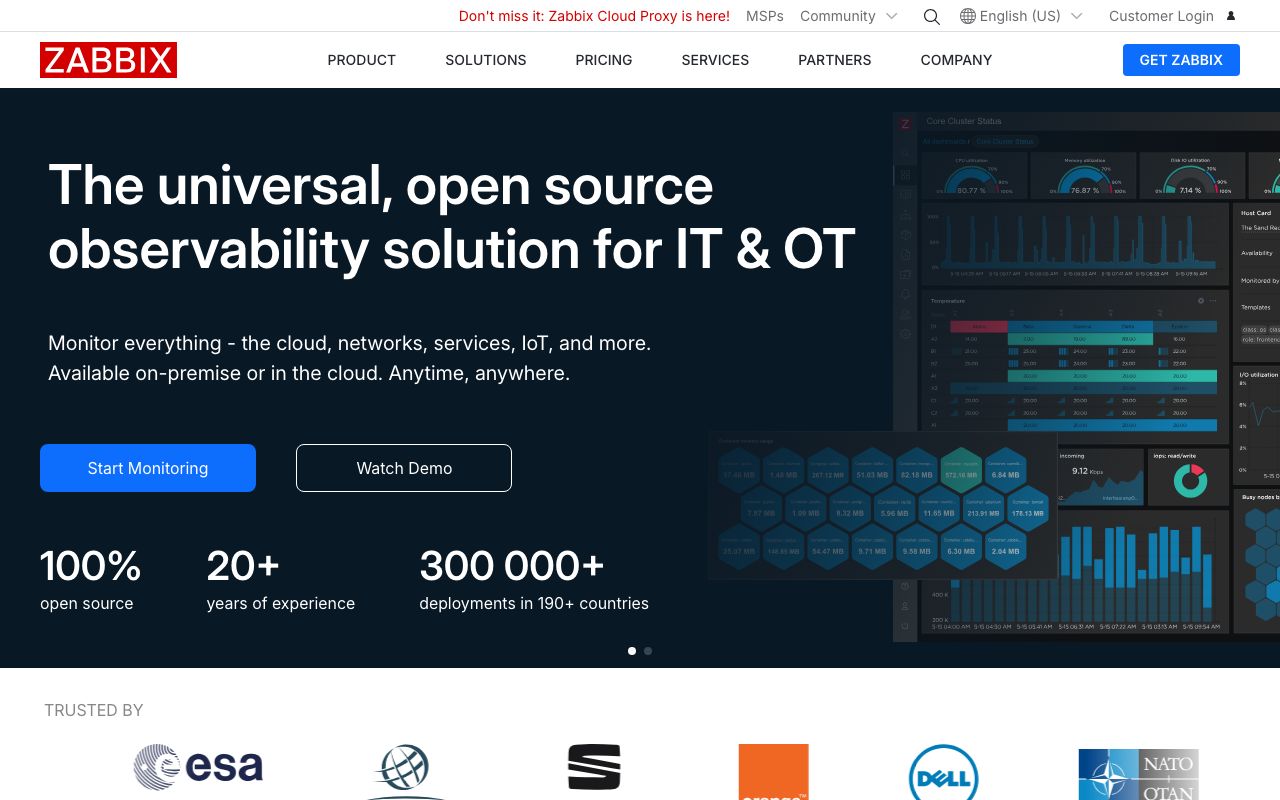
- What it is
- Open-source, self-hosted monitoring platform for servers, networks and applications, whose maker sells technical support rather than the software.
- Check types
- Server agent
- Prices checked
- 4 Nov 2026
Zabbix is a full monitoring platform under the AGPL, with website checks as one feature among servers, networks and applications. Nothing sits behind a paid tier; the company sells technical support instead of the software.
It is the long-haul choice here: a server, a database and a web interface of its own, and a learning curve to match. Running it for website checks alone means operating far more platform than the job needs.
Good fit: an organisation that wants one self-hosted platform for everything and can staff it.
6. Checkmk
checkmk.com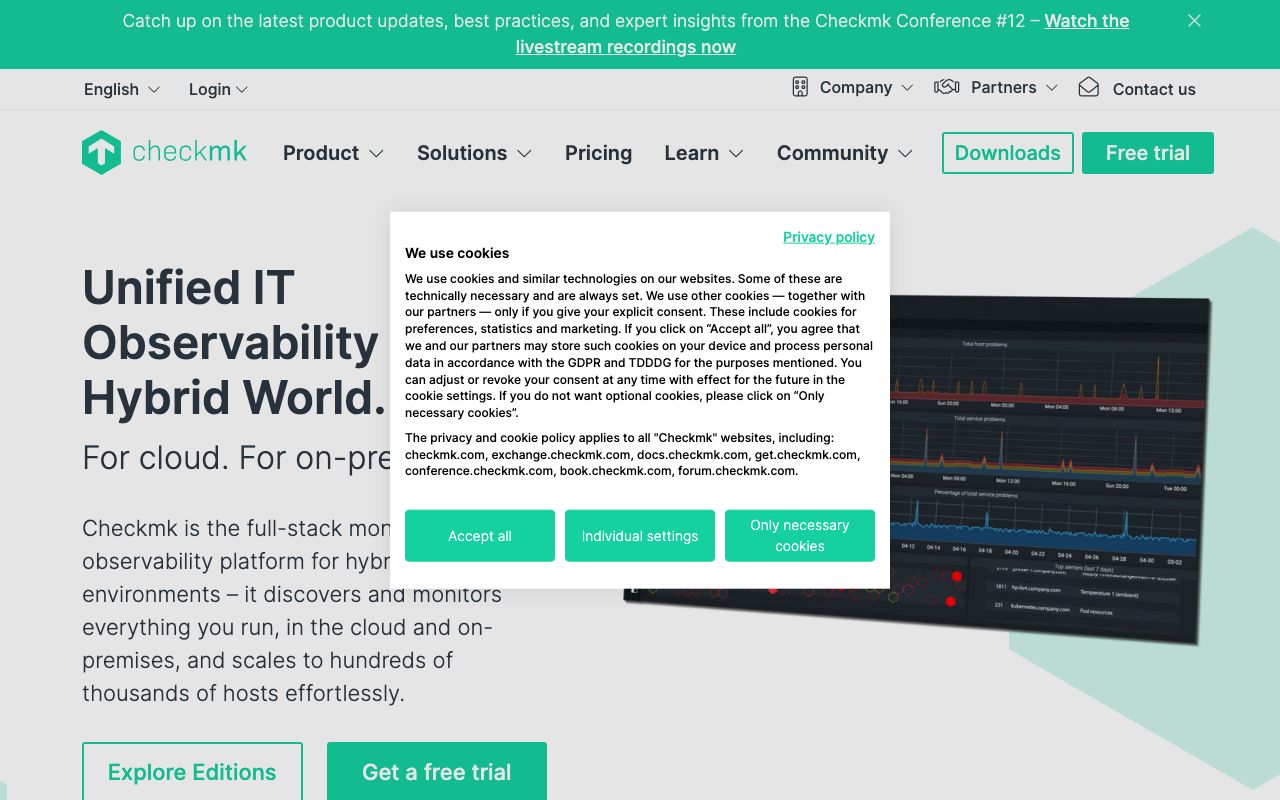
- What it is
- Self-hosted infrastructure monitoring whose free Community edition is aimed at smaller fleets, with paid editions priced per host.
- Check types
- Server agent
- Prices checked
- 4 Nov 2026
Checkmk's free Community edition is open source and arrives more assembled than most of this list: discovery, agents and a working interface from the first boot, easily scalable up to about 100 hosts.
Its centre of gravity is infrastructure rather than websites, and the paid editions above Community are where synthetic monitoring lives. As the free self-hosted base for a server fleet that also wants HTTP checks, it earns its place.
Good fit: a fleet that needs server monitoring first and website checks second, from one free install.
7. OneUptime
oneuptime.com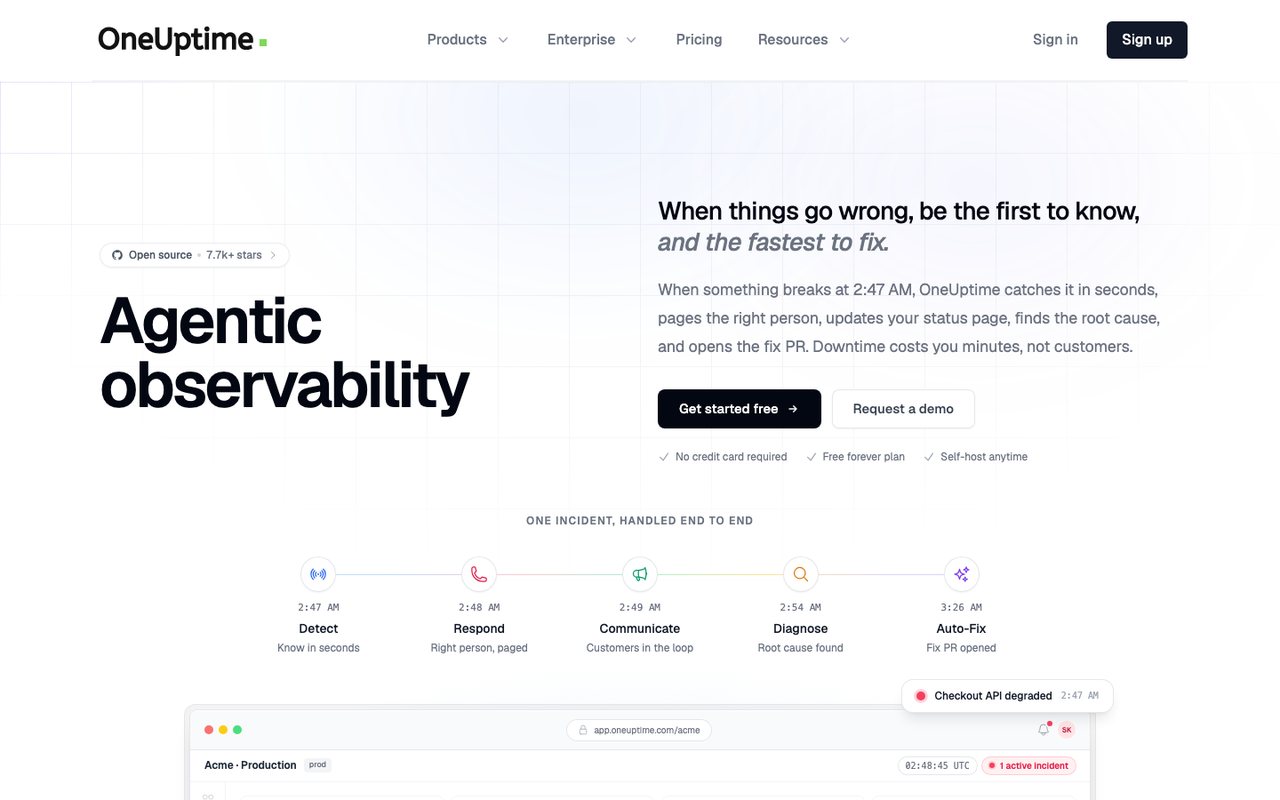
- What it is
- An open-source observability platform that bundles uptime and synthetic monitoring, status pages, incident management, on-call alerting, logs, metrics, traces and real-user monitoring, sold as SaaS or self-hosted.
- Check types
- Website (HTTP), Keyword, Ping, Port, Cron jobs (heartbeat), API, DNS, SSL certificate, Domain expiry, Browser transactions, Real user monitoring, Server agent, Third-party dependencies, Status pages, Logs, APM / tracing, Network devices
- Free plan
- $0 plan, active monitors $1 each a month
- Paid plans from
- $20 per user a month, billed yearly, plus $1 per active monitor
- Fastest check
- 1 minute
- Prices checked
- 8–12 Oct 2026
OneUptime is the open-source attempt at the whole category in one platform: monitors, status pages, incident management, on-call and logs. Self-hosting it gives you all of that without a bill.
Breadth is also the cost. You are operating a platform, with the moving parts that implies, where Uptime Kuma or Gatus would have been one container. The hosted version exists for teams that want the breadth without the operations; its free tier is mostly a status page with monitors billed per active monitor.
Good fit: a team that wants status pages, on-call and monitoring from one self-hosted codebase and accepts the operational weight.
The single-vantage problem
Every self-hosted tool above checks from where it runs. When your data centre has a routing problem, your monitor may see a healthy site your customers cannot reach; when the monitor's own host dies, silence reads as uptime. GitHub-based Upptime escapes the shared-fate half of this and still checks from one provider's runners.
Running the same stack in a second region fixes it and doubles the operations. That cost, more than any feature, is what hosted monitoring charges for: vantage points you do not maintain, agreeing before anyone is woken.
Where Uptimia stands
Uptimia is not open source, which is why it is not in the list above. It is the other side of the trade these tools offer: hosted checks from many regions, confirmed before they alert, with nothing for you to operate. The free plan runs 1 monitor at 5-minute checks, and the paid plans carry a month-long trial with no card.
The two sides also combine. A hosted uptime check pointed at your Uptime Kuma or Grafana instance covers the watcher itself, and a heartbeat catches the Actions workflow or cron job that quietly stopped. Self-hosted for depth inside, one outside check for the view from the internet.