Free server monitoring splits into two families. Open-source agents (Netdata, Zabbix, Prometheus, Checkmk) cost nothing in money and plenty in setup and upkeep; you install them, and you answer for them. Hosted free tiers cost nothing in either, and in exchange watch only a server or two.
The 6 options below cover both families, with each vendor's own figures. For watching websites rather than the machines behind them, the free uptime monitoring and free website monitoring pages carry those lists.
Inside and outside views
An agent on the machine sees causes: CPU load climbing, memory leaking, a disk filling, a process gone. An outside check sees what your users see: the service answering, or silence. Neither replaces the other. The agent explains the outage; the outside check is how you find out it happened, because an agent on a dead machine reports nothing at all.
Every tool below gives you the inside view free. The question that decides between them is what each one asks of you in return.
6 free server monitoring tools
Uptimia wrote this page. The other tools are not ranked: their order is not a verdict on which is better.
1. Netdata
netdata.cloud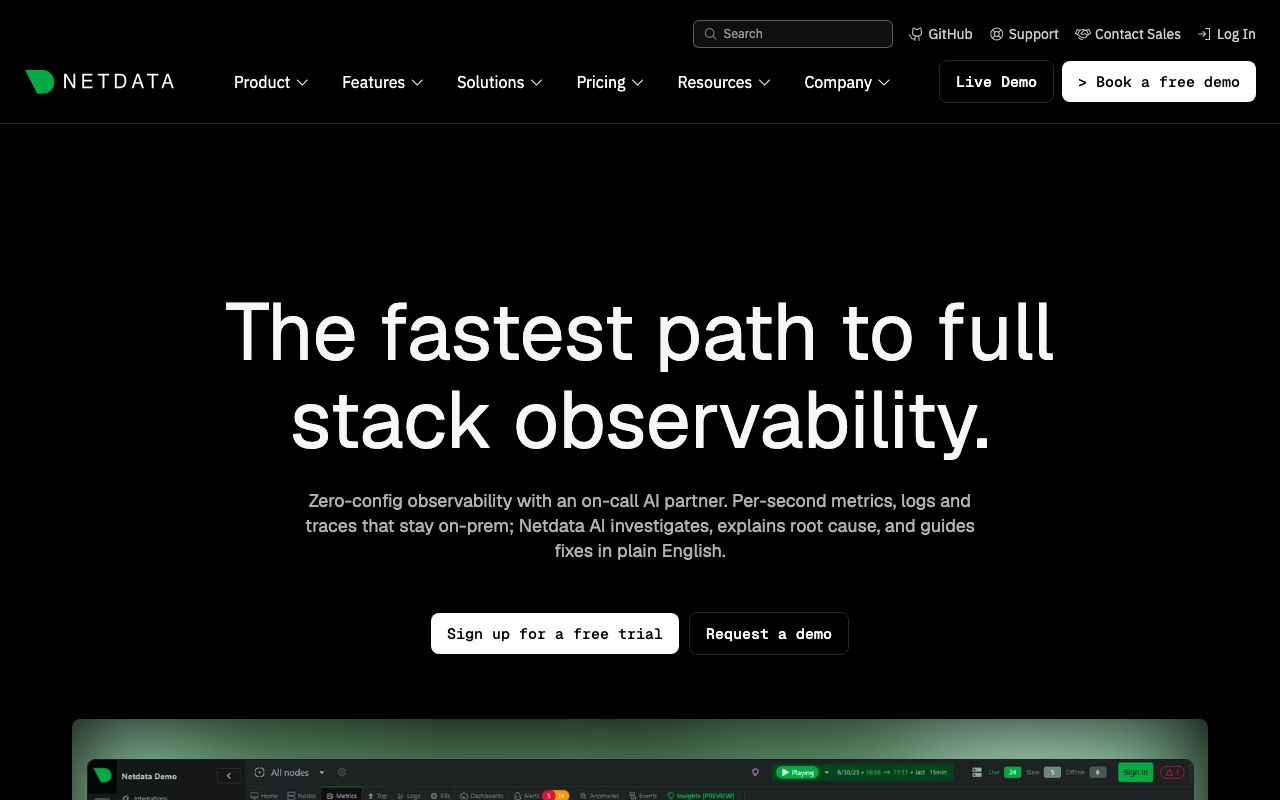
- What it is
- Open-source monitoring agent that collects per-second metrics from servers and containers, with a hosted cloud for dashboards and alerts.
- Check types
- Server agent
- Prices checked
- 4 Nov 2026
The Netdata agent is GPLv3+ licensed and collects per-second metrics, which makes it the tool you open when something is wrong right now. It installs in minutes on Linux, Docker, Kubernetes, macOS and Windows.
The hosted side has a free Community plan for up to 5 connected nodes with one custom dashboard per room and notifications to Discord, email and the mobile app. Business starts at $7 per node per month billed annually.
Good fit: a handful of boxes you want live, second-by-second dashboards for.
2. Zabbix
zabbix.com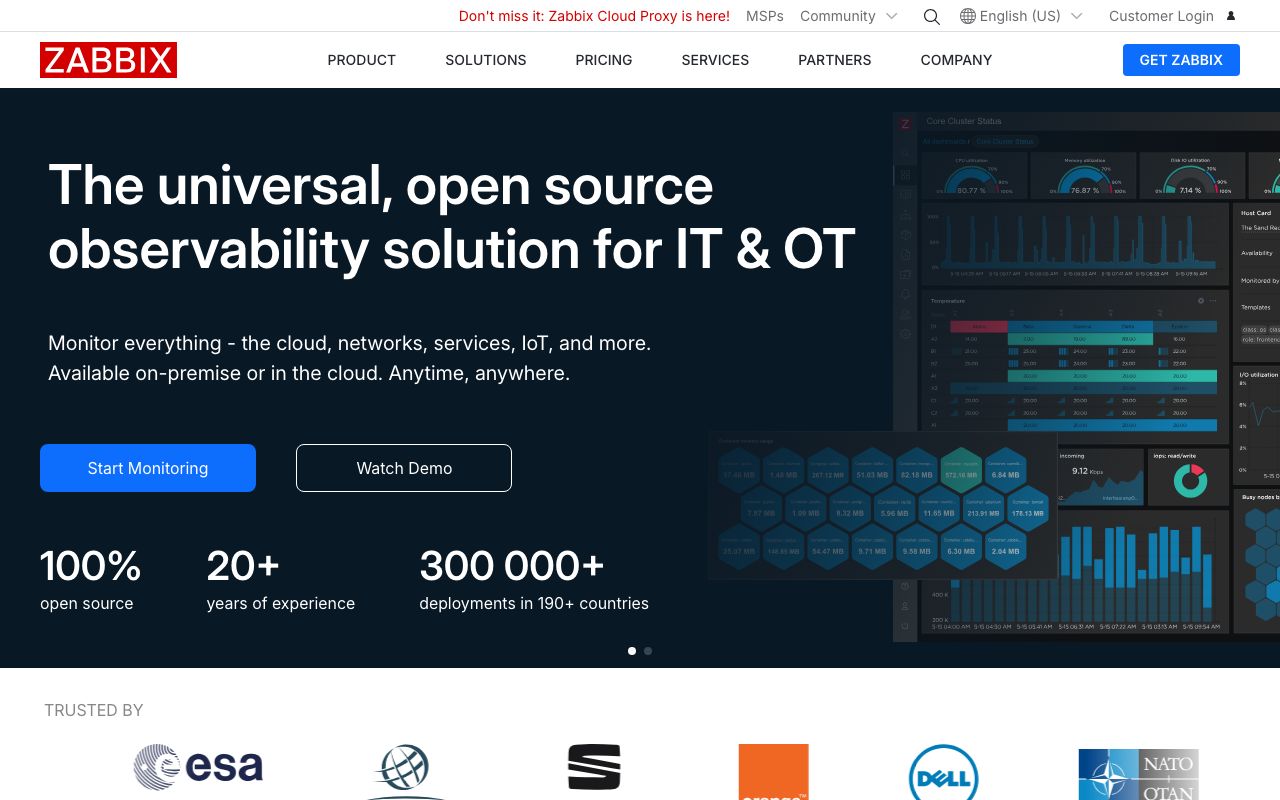
- What it is
- Open-source, self-hosted monitoring platform for servers, networks and applications, whose maker sells technical support rather than the software.
- Check types
- Server agent
- Prices checked
- 4 Nov 2026
Zabbix is the opposite trade from a hosted free tier: the whole platform is open source under the AGPL, with no tier above it holding features back. The company earns its money selling technical support, which commercial users are asked, and never required, to buy.
What it asks of you is operation. Zabbix is a server, a database and a web interface you install, upgrade and back up yourself, and its depth (triggers, templates, discovery, escalations) comes with a matching learning curve.
Good fit: a team with many hosts, real monitoring requirements and the time to own the stack.
3. Prometheus
prometheus.io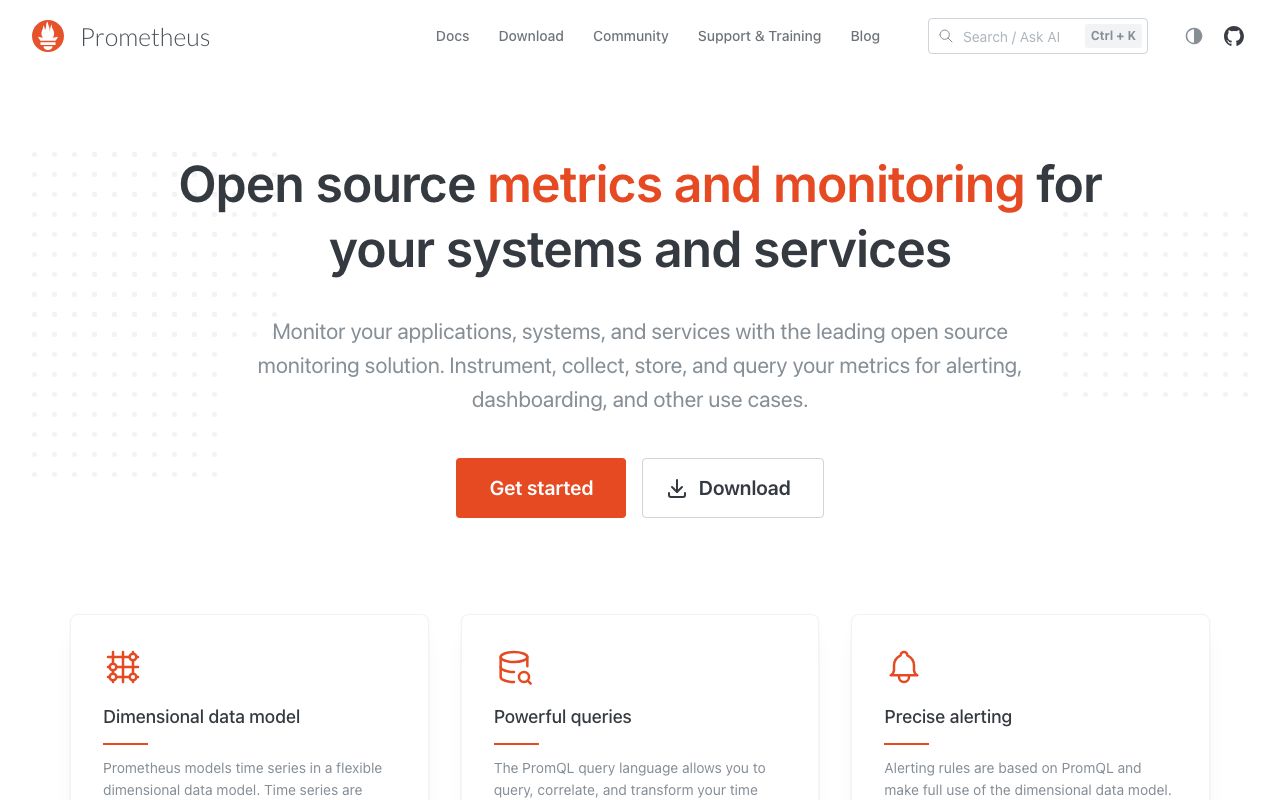
- What it is
- Open-source metrics and alerting system under the Apache 2 license, a CNCF graduated project; servers are monitored by scraping its node exporter.
- Check types
- Server agent, Website (HTTP), Ping, Port, DNS
- Prices checked
- 4 Nov 2026
Prometheus is a metrics system under the Apache 2 license and a CNCF graduated project. Servers enter the picture through its node exporter, a single static binary that exposes a wide variety of hardware- and kernel-related metrics (CPU, filesystem, network) on *nix systems; Windows has a separate Windows exporter.
Prometheus gives you a data model and a query language rather than a finished product. Dashboards usually mean adding Grafana, alert routing means another component, and the free price buys a toolkit you assemble.
Good fit: teams that treat monitoring as infrastructure code and want the ecosystem everything else integrates with.
4. Checkmk
checkmk.com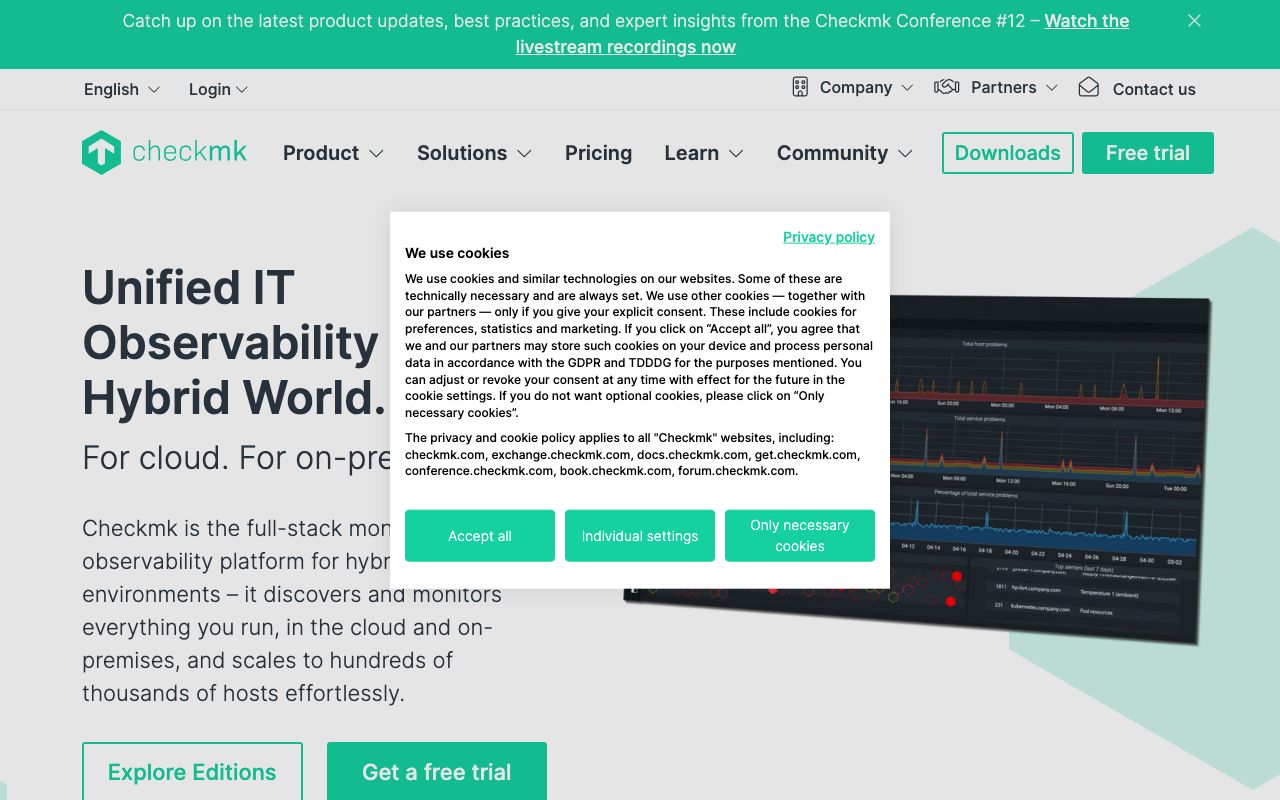
- What it is
- Self-hosted infrastructure monitoring whose free Community edition is aimed at smaller fleets, with paid editions priced per host.
- Check types
- Server agent
- Prices checked
- 4 Nov 2026
Checkmk's Community edition is free, open source and self-hosted, pitched at small infrastructures and easily scalable up to about 100 hosts. It arrives closer to finished than Zabbix or Prometheus: agents, discovery and a usable interface out of the box.
Paid starts with Pro at €190 a month billed annually, priced by host count. After a 30-day paid trial, a self-hosted installation continues in a free mode of 750 services on one site.
Good fit: a conventional server fleet that wants structured monitoring without assembling it from parts.
5. Hyperping
hyperping.com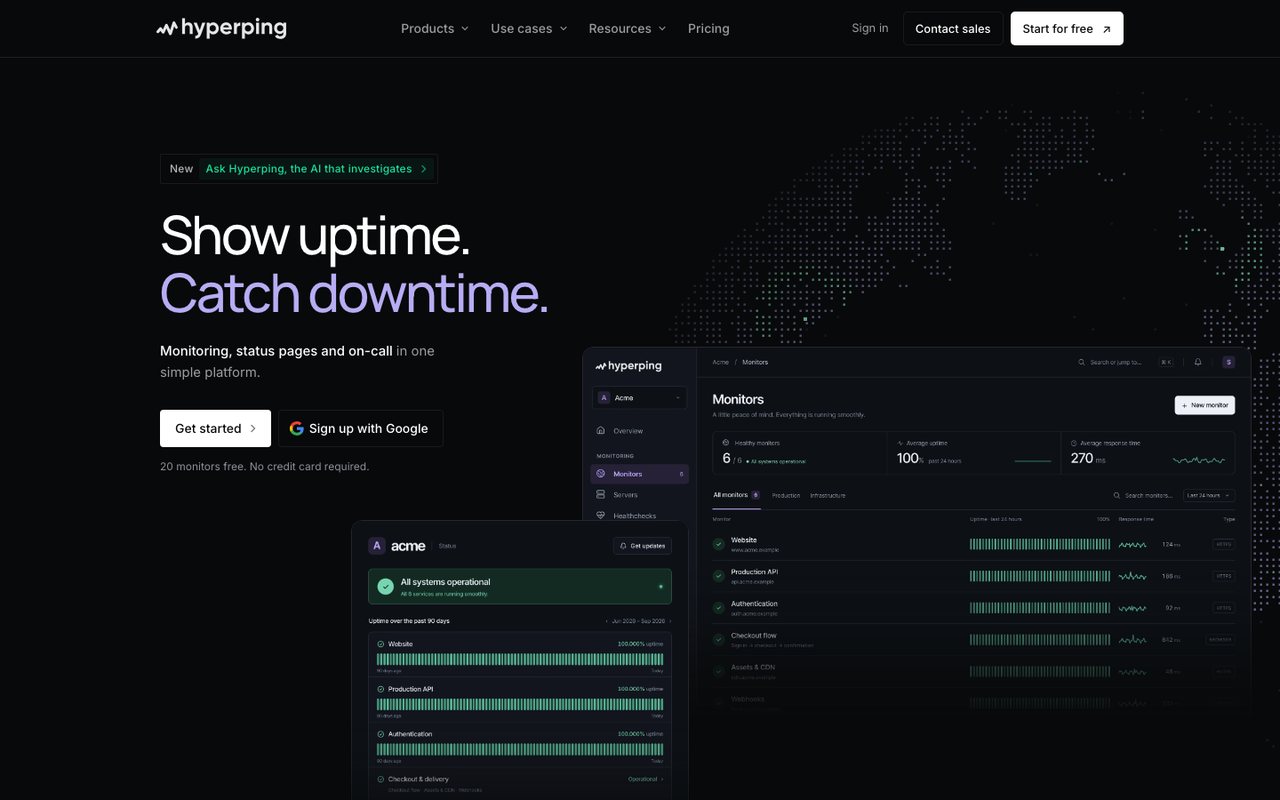
- What it is
- Uptime, cron, SSL and browser-check monitoring with status pages, on-call schedules and escalation in one product, run from France.
- Check types
- Website (HTTP), Keyword, Ping, Port, Cron jobs (heartbeat), API, DNS, SSL certificate, Domain expiry, Browser transactions, Server agent, Status pages, Logs
- Free plan
- 20 monitors, checks every 5 minutes
- Paid plans from
- $24.17 a month, billed yearly
- Fastest check
- 20 seconds
- Prices checked
- 8–12 Oct 2026
Hyperping's free tier is uptime-first and includes one server agent beside its 20 monitors at 5-minute checks, with one status page and no card at signup.
One free agent is one server's CPU, memory and disk. That is thin next to the open-source tools above, and enough for the common case of a product running on a single box.
Good fit: a side project with one server, where the site checks matter as much as the machine.
6. 360 Monitoring
360monitoring.com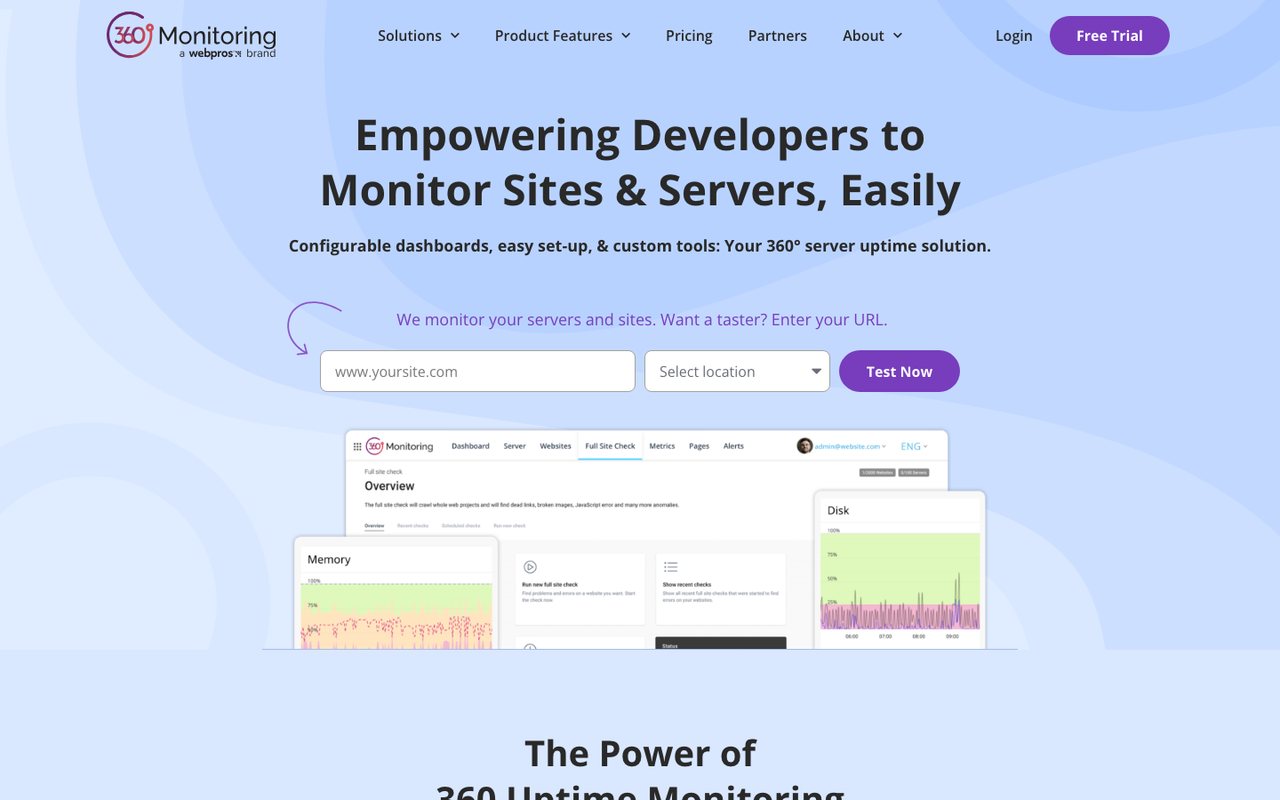
- What it is
- Website uptime and server monitoring from WebPros, with an open-source server agent, IP blocklist checks and a site crawler, built into the Plesk control panel.
- Check types
- Website (HTTP), Keyword, Ping, Port, SSL certificate, Server agent, Blacklist, Status pages
- Free plan
- 5 sites, 1 server, checks every 10 minutes
- Paid plans from
- $4.99 a month, billed monthly
- Fastest check
- 1 minute
- Prices checked
- 8–12 Oct 2026
360 Monitoring's free Lite plan pairs one server monitor with 5 site monitors at 10-minute checks, with email alerts and no card. It comes from WebPros and lives naturally inside the Plesk control panel.
The free tier keeps 24 hours of data, so it answers "how is the server right now" and forgets the rest. Pro at $4.99 a month extends retention to 30 days, billed monthly only.
Good fit: a Plesk-hosted server whose owner wants basic metrics where they already work.
What self-hosting really costs
The open-source tools above are free the way a puppy is free. Someone patches the monitoring host, upgrades the version, tunes the alerts and backs up the database, and that someone is you. For a team with many servers the trade is usually worth it. For two machines it rarely is.
Self-hosting also creates a blind spot: when the monitoring server itself dies, the silence looks like health. The fix costs little, whichever stack you run: put an outside uptime check on your Grafana or Zabbix interface, and a heartbeat on the pipeline that moves your metrics, so the watcher has a watcher.
Pairing inside with outside
Whatever you picked above handles the inside view. The outside half is cheap to add: an uptime check confirms the service answers from the internet, from more than one region, which no agent can do from within the network. The free uptime monitoring page lists the no-cost ways to get that view.
Uptimia has no free server monitoring. Our server agent comes with the paid plans, bundled with the uptime checks and heartbeats, on a month-long trial with no card. What is free from us is the outside view: the free plan's 1 monitor and the no-account health check.